

Rutland Area Real Estate Market Review
How does this year compare to how the market was last year at this time?
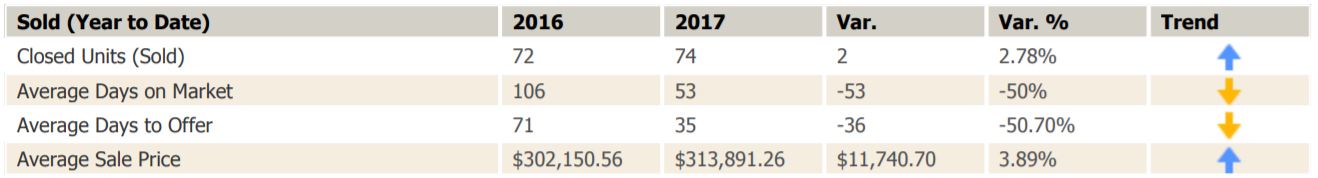
—–> 2017 YTD vs. 2016 January 1st to October 25th <—–
So far 74 homes have closed this year which is 2 more homes that sold for the same time period last year! With almost 30 properties still pending and over two months left in the year, the Rutland area is showing signs of having a great year and that more and more people are moving to the town.
New construction homes seem to be picking up in town as the lack of inventory still hasn’t caught up to the buyers demand.
Related Article: When Considering a New Construction Home; Should you use a Realtor®?
Although people are buying, those houses that are currently on the market have been for about 114 days on average which is just a slight improvement over last year. There are a lot of factors that come into play with this number; is the home distressed? Does it not show very well? Is it being marketed correctly? And the biggest one – Is it priced right?
Related Article: How to sell your home in 10 days
The homes that have sold, however, were on the market an amazing 50% less days on market than those that sold last year!! The average sales price has increased by almost 4% bringing the average price up to $313,891 vs $302,150 at this time last year.
Overall the Rutland Market appears to be doing well.
Download the full report below to see all the current stats.
[otw_shortcode_button href=”https://theprosrealestateteam.com/wp-content/uploads/2017/10/Rutland-10-25-17.pdf” size=”large” icon_position=”left” shape=”radius” color_class=”otw-green” target=”_blank”]Rutland Real Estate Market 2016 vs 2017 – Jan to Oct 25th[/otw_shortcode_button]
Thinking about selling your home in Rutland? See what your home could be worth using our free quick home valuation.
[otw_shortcode_button href=”http://www.sellingworcestercounty.com/” size=”large” icon_type=”general foundicon-checkmark” icon_position=”left” shape=”radius” target=”_blank”]FIND OUT WHAT YOUR RUTLAND HOME IS WORTH – QUICK, EASY & FREE[/otw_shortcode_button]
Looking to buy a home in Rutland? Check out whats currently available for sale